
Prism – Explain & Query Analysis and Tuning
Unique Design & Functionality:
Prism has unique design aspects and functionality not available in any other Explain/Query analysis tool. As a result, users will be able to carry out analysis that in the past has meant significant time would need to have been allocated. Prism™ changes this.
Productivity:
As Prism has been designed to reduce the time taken and also the level of expertise necessary to analyse the Explains produced by the Teradata Optimiser, and the underlying queries themselves, productivity is substantially increased beyond anything previously seen with resultant impacts to service levels and end-user satisfaction.
Cost Effective Pricing & Licensing:
Unlike other solutions currently available, when purchased as a stand-alone solution for analysts, developers and DBA’s, or as part of the Visual Edge product, Prism is more than an order of magnitude less expensive, but with a significantly greater functionality and ease of use. Prism is deployed to an end-user’s PC, and licensing can be by one of several methods;
- Per user License (Perpetual or multi-year rental)
- Site License (Perpetual or multi-year rental)
- Enterprise License (Perpetual or multi-year rental)
Speed of Implementation:
As a result of the extremely user-friendly design, even the most junior staff can install, run and use of Prism™ within minutes of loading the software onto their PC. Training is usually 1-2 hours per class of users.
ROI:
Taking the productivity gains that come as a result of the functionality and productivity benefits of Prism™ with the pricing, licensing and speed of implementation benefits described above, the ROI realised is greater and realised more quickly than that possible by using any other tool or manual method.
Query/Explain analysis and optimisation
Prism is a powerful Query/Explain analysis tool and is designed for a wide range of users of mixed ability, from expert level to relative novices. The tool has been designed based on the knowledge gained from many years of field and customer-based experience. The key to Prism’s success is the extremely user-friendly design and interface.
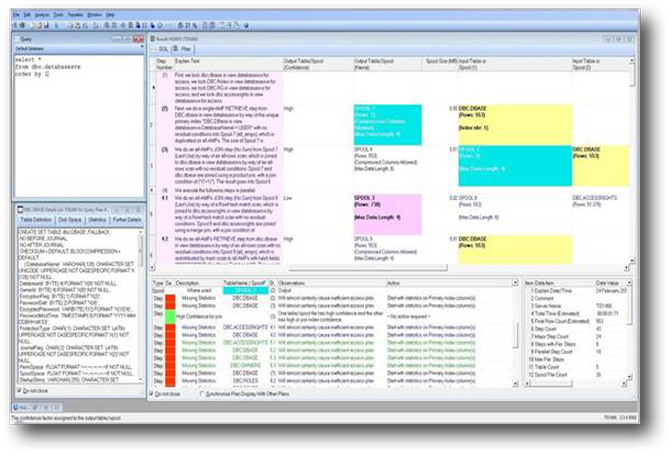
By presenting the Explain plan for any SQL statement in a logically arranged visual grid, users are immediately able to comprehend quality, problems and issues with any query. As further analysis is carried out, all of the relevant functionality that supports the analysis (or resultant remedial actions) is available to the user via in-grid right-mouse-click selections or drop-down menus.
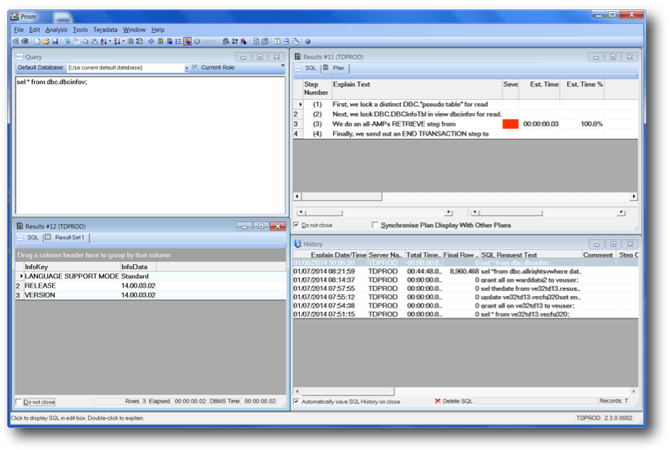
Using input methods such as “cut and paste” from external sources or directly hyperlinked in from another application, the Prism user can import the SQL to be Explained. Once imported, the query is passed to the Teradata system for “Explaining”, and the returned information is inserted into a grid designed for easy analysis.
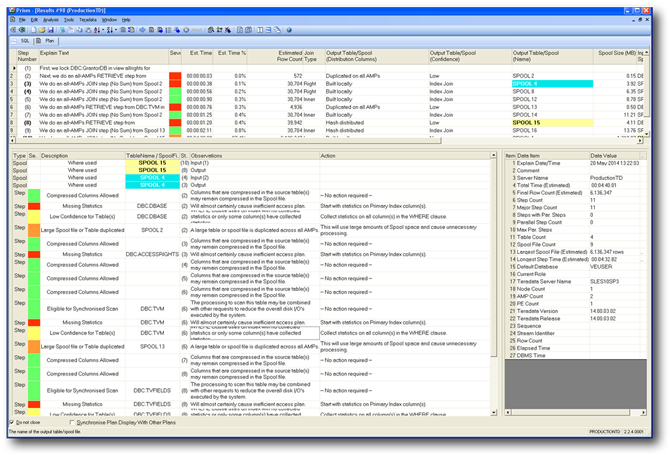
The grid allows a Step by Step analysis approach, so that all elements of each Step are placed into the corresponding column of the grid, allowing successive Steps to be immediately compared for Estimated Time, Elapsed Time, Percentage of Total Time, Estimated Row Counts, Join Type, Table and Spool Distribution-Confidence and Name, AMPs Used and Step Type etc. The grid can be sorted by any column/step parameter.
For further analysis of the SQL request of interest, the user simply selects “Analyse Using Current Options” from the “Analysis” drop down menu on the main toolbar. Further choices regarding analysis allow the user to choose which aspects of the SQL request are to be analysed – from a list of Cartesian Product Joins, High/Low Confidence for Join and Tables, Confidence for Index Join, Large Spool File or Table Duplicated, Missing Statistics, Missing WHERE Clauses for Tables. Issues found are listed with one of 4 steps of severity.
Having found any issues in the SQL and then listed them, Prism will suggest – using natural language – corrective or remedial measures to deal with the identified problems. Visual tracking of which Steps a Spool file is used in and crucially where they were created is provided, allowing rapid analysis of likely related problems. Facilities such as “show table definition”, “open collects statistics wizard” etc are all available from shift-right-click drop down menus.
Key Features
Annotation & Collaboration
Allow the user to add in detailed notes about an Explain plan which can then be shared with other prism users and/or reviewed at a later point in time.
SQL Stream
A sequence of SQL queries (e.g. a Bteq script or queries from a BI tool such as Cognos) can be processed without any requirement to manually create and populate temporary tables etc. The user chooses which queries should be executed and or analysed.
Collect Statistics
Collect Statistics recommendations can now be executed from within Prism, allowing the user to explain a query, follow statistics recommendations and re-explain using a single tool.
Plan Save – for “Before & After” Comparison
Ability to save and store Explain Plans for “before and after” comparisons (Teradata upgrades, Application changes etc)
Analyse AND Execute SQL
Queries can be executed as well as explained, using a single tool. Visual display of Actuals and Estimates for running queries.
Multiple Visual side-by-side comparison
Multiple plans can be simultaneously compared to identify performance differences – both symptoms and causes.
Identify Query Conditions
Automatically identify conditions that occur in ‘bad queries’ without having to read (pages of) text.
Hash Distribution Columns Displayed
The columns used to control the distribution of a SPOOL file are specifically displayed.
Search by User Specified Criteria & Load SQL from Query Log (DBQL) Tables
Allows the user to retrieve the text of one or more queries from the Query Log tables on the Teradata system. This allows (for instance) all queries for a particular session to be loaded, easily re-creating an “SQL Stream” (perhaps the processing done for a particular batch job or BI report).
Natural Language Optimisation
Suggestions automatically provided in natural language for fixing or optimising problem queries.
WHERE Clause
Any selection criteria used in a step is specifically displayed.
Monitor a Running Query
Prism will regularly monitor the query that the user is currently executing and display ‘Actual’ value (for Row Count and Elapsed Time) against each completed step in the explain plan.
More Info about Tables
Add in more data about the tables referenced in a query. The additional data will include existing statistics, perm space usage and distribution, existing indexes.
Spool/Table Usage
Easily identify where SPOOL files or tables are used in a query.