
Visual Edge – Teradata Performance Tuning 
Productivity:
Visual Edge brings significant capability to Teradata users in tuning their Teradata systems. Automation of the acquisition and integration of all performance data eliminates the time spent in preparation of data to analyse, manage and tune Teradata performance, and allows support staff to spend their time exclusively analysing and managing Teradata performance.
With advanced visualization and sophisticated workflow design, Visual Edge users typically see an order-of-magnitude productivity improvement in tuning Teradata performance. For severe and high-impact complex performance problems, Visual Edge enables Teradata customers to rectify the most difficult issues with ease.
Speed of Implementation:
Visual Edge can be fully installed in less than 30 minutes, with User training taking typically 1-2 day per class of users. The Visual Edge Data Collectors take approximately another 30 minutes or so to set up.
Rapid ROI:
As a result of complex performance degradation problem-resolution the cost of Visual Edge is typically recovered the first time it is used. Similarly, when the savings from column compression modelling are made, usually in less than a day, the outlay for Visual Edge is covered immediately.
Compression Modelling and Implementation on-Demand:
One of the most powerful facilities in Teradata, and frequently under-used, Compression gives dramatic space savings, and resultant Cap-Ex/Budget savings.
Ward’s fully implemented compression modelling and execution functionality allows clients to model and execute compression on the largest of data warehouses in just several days. Clients will see recovery of storage space in the range of 15-40% (depending on individual circumstances).
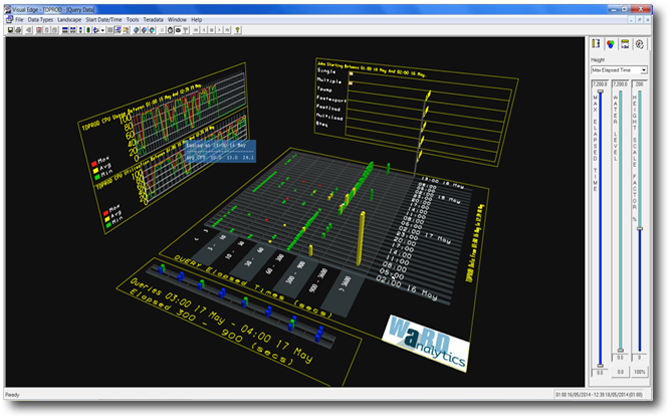
Performance Tuning, Analysis & Management
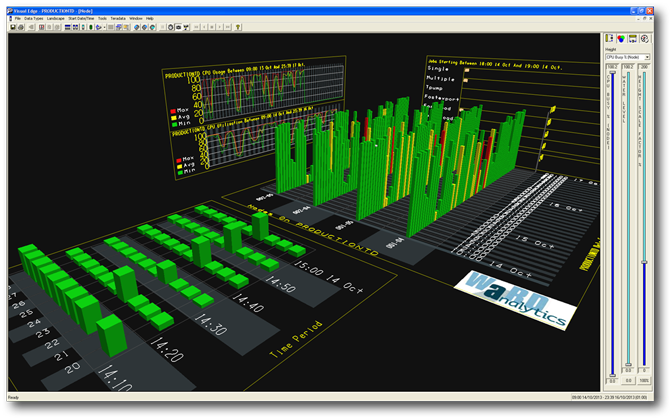
Using a sophisticated 3D visualization platform, Teradata Performance data is presented to the user in a series of consistent and easy to use visual “Landscapes”.
Landscapes are provided for a wide range of metrics, views and measures, including Multi-Value Column Compression modelling. Visual Edge can be used by staff with a wide range of skill levels, from expert to relatively junior. All data processing is taken care of by Visual Edge, allowing the user to spend their time analyzing the data presented, rather than managing collection, integration and presentation.
DBA’s and Technical/Operations staff are the prime beneficiaries of the use of Visual Edge, however Development Staff and Power Users will also benefit by being able to rapidly analyze the results and likely impacts of new application developments, production environment changes and new application-integration effects.
Key Features
Visual drill-down/through
Rather than simply using traditional graphing techniques, Visual Edge allows point-and-click drill-through to underlying performance data, ensuring efficient analysis and productivity.
Data Integration
Visual Edge takes care of all data collection and (critically) the integration of the various performance data from multiple Teradata tables (and Ward’s own proprietary performance data – see below).
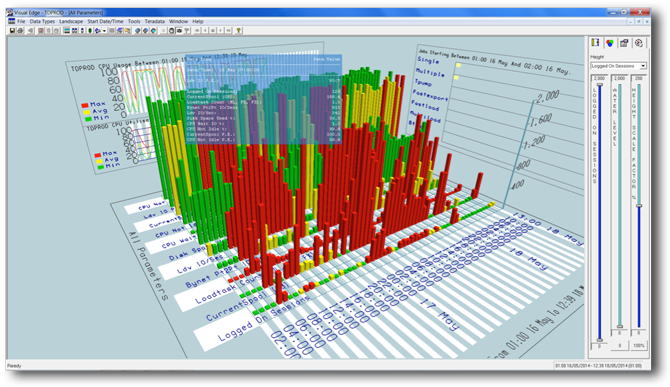
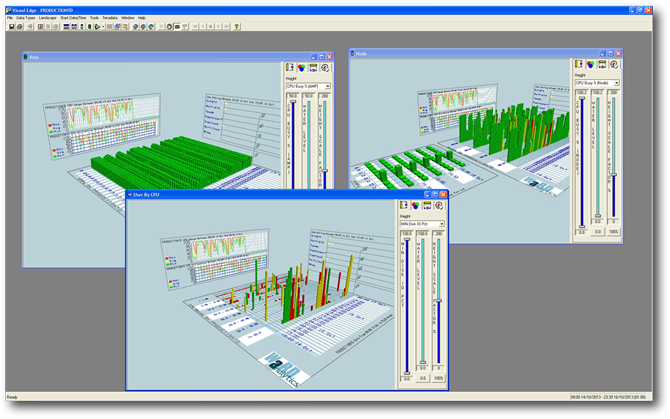
Data Visualisation
With Teradata producing potentially millions of rows of performance data every day, advanced visualisation is the most effective way of showing and interacting with this volume of data.
“Best Practice” Implemented
Wherever possible, and wherever it exists, Ward have implemented Teradata best practice throughout its suite of products. This best practice is based on many years of real-world hands-on experience.
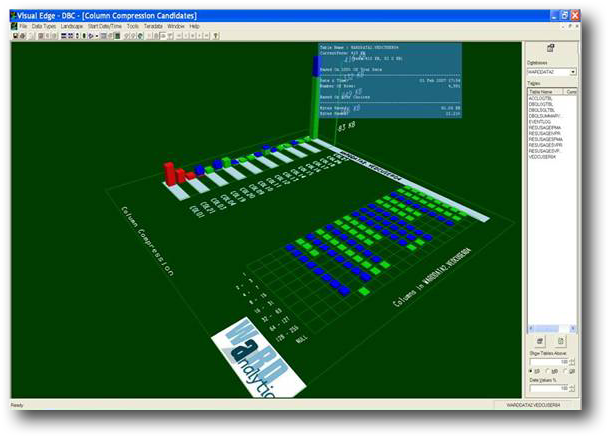
Column compression modelling – MVC, Algorithmic and Block-Level
Visualisation allows what-if modelling of compression on the Teradata system and is approximately an order of magnitude quicker than conventional manual methods.
Proprietary data
Visual Edge custom Data Collectors generate proprietary performance data that simply does not exist in Teradata. This proprietary data allows identification (down to individual User and SQL statement step-level) of the underlying root cause of performance problems.
True root-cause analysis
As Visual Edge is based on extensive field-based practical experience, Ward’s performance tuning tools are designed with the goal of root cause problem analysis – down to individual user and their SQL. By simply passing the SQL across to Ward’s Prism Query tuning tool for further analysis, the cause of the problem and the fix to rectify it are identified in minutes.
Historic to Real Time data
Visual Edge is able to view data across an almost limitless time range, with the only practical limit being the availability of the relevant performance data and the time range of the area being investigated. Visual Edge is also able to be run in real time, with the full diagnostic capabilities being available irrespective of whether the use is reviewing 10 minutes of data or 10 months.
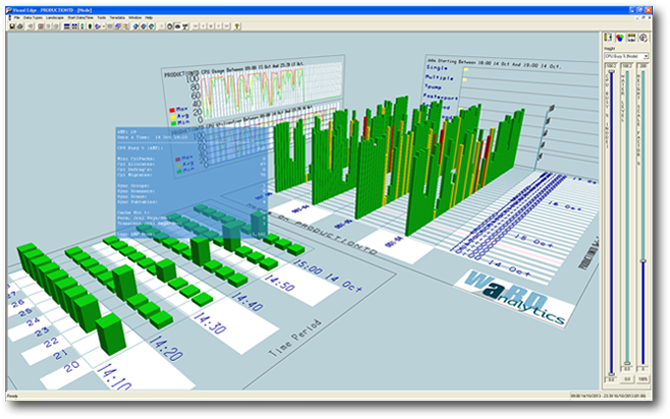
Single environment view of multiple/different parameters
Visual Edge is not limited by the physical size of the Teradata system, and has a variety of ways of looking at All of the available performance data, allowing understanding of the performance of EDW whether it’s a 2 node or 102 node etc. system.